|
ID |
Crossing |
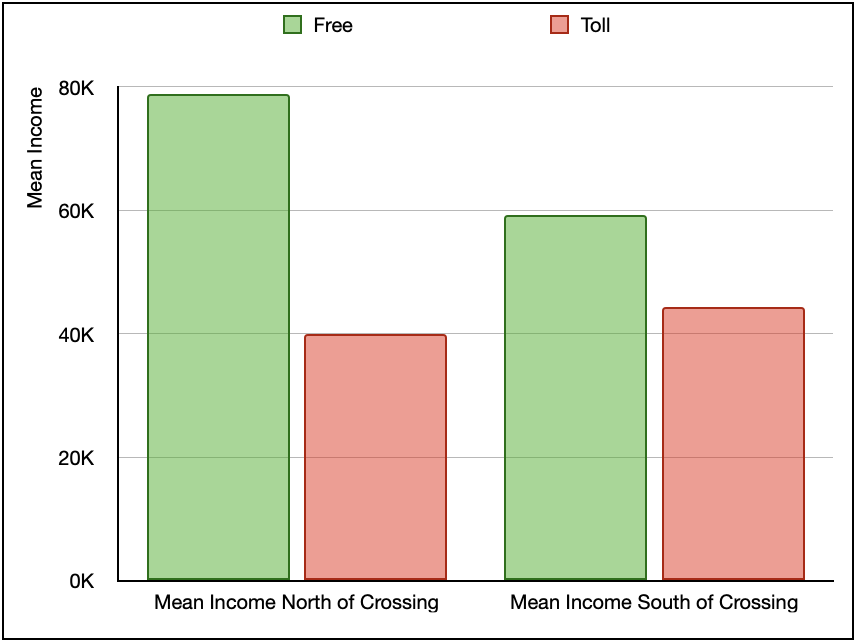
Mean Income North of Crossing |
Mean Income South of Crossing |
Toll |
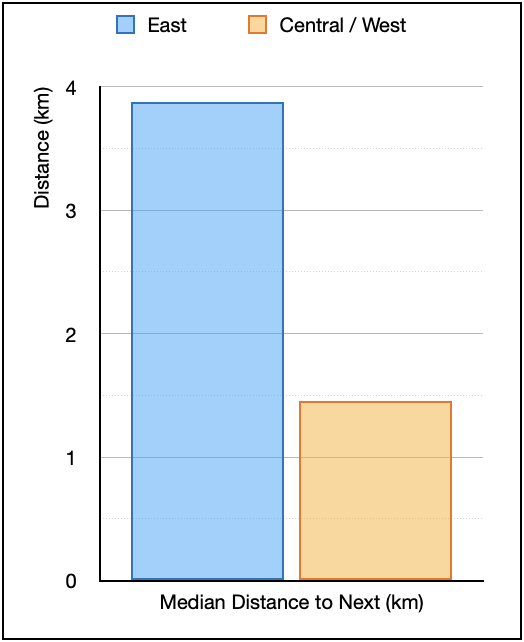
Distance to Next E (km) |
Distance to Next W (km) |
Median Distance to Next (km) |
|
X |
Silvertown |
34,260 |
44,370 |
YES |
13.0 |
1.4 |
7.2 |
|
1 |
Blackwall |
45,720 |
44,370 |
YES |
1.4 |
2.8 |
2.1 |
|
2 |
Rotherhithe |
45,720 |
44,370 |
NO |
2.8 |
2.0 |
2.4 |
|
3 |
Tower |
45,720 |
44,370 |
NO |
2.0 |
0.9 |
1.4 |
|
4 |
London |
99,390 |
48,000 |
NO |
0.9 |
0.4 |
0.7 |
|
5 |
Southwark |
99,390 |
48,000 |
NO |
0.4 |
0.8 |
0.6 |
|
6 |
Blackfriars |
99,390 |
48,000 |
NO |
0.8 |
1.0 |
0.9 |
|
7 |
Waterloo |
80,760 |
48,610 |
NO |
1.0 |
1.1 |
1.0 |
|
8 |
Westminster |
80,760 |
48,610 |
NO |
1.1 |
0.7 |
0.9 |
|
9 |
Lambeth |
80,760 |
48,610 |
NO |
0.7 |
0.8 |
0.7 |
|
10 |
Vauxhall |
80,760 |
66,220 |
NO |
0.8 |
1.5 |
1.1 |
|
11 |
Chelsea |
116,350 |
66,220 |
NO |
1.5 |
1.2 |
1.4 |
|
12 |
Albert |
116,350 |
66,220 |
NO |
1.2 |
0.5 |
0.8 |
|
13 |
Battersea |
116,350 |
66,220 |
NO |
0.5 |
2.1 |
1.3 |
|
14 |
Wandsworth |
62,910 |
66,220 |
NO |
2.1 |
1.6 |
1.9 |
|
15 |
Putney |
62,910 |
66,220 |
NO |
1.6 |
2.7 |
2.1 |
|
16 |
Hammersmith |
62,910 |
76,610 |
NO |
2.7 |
3.3 |
3.0 |
|
17 |
Chiswick |
44,490 |
76,610 |
NO |
3.3 |
2.0 |
2.6 |
|
18 |
Kew |
44,490 |
76,610 |
NO |
2.0 |
3.6 |
2.8 |
|
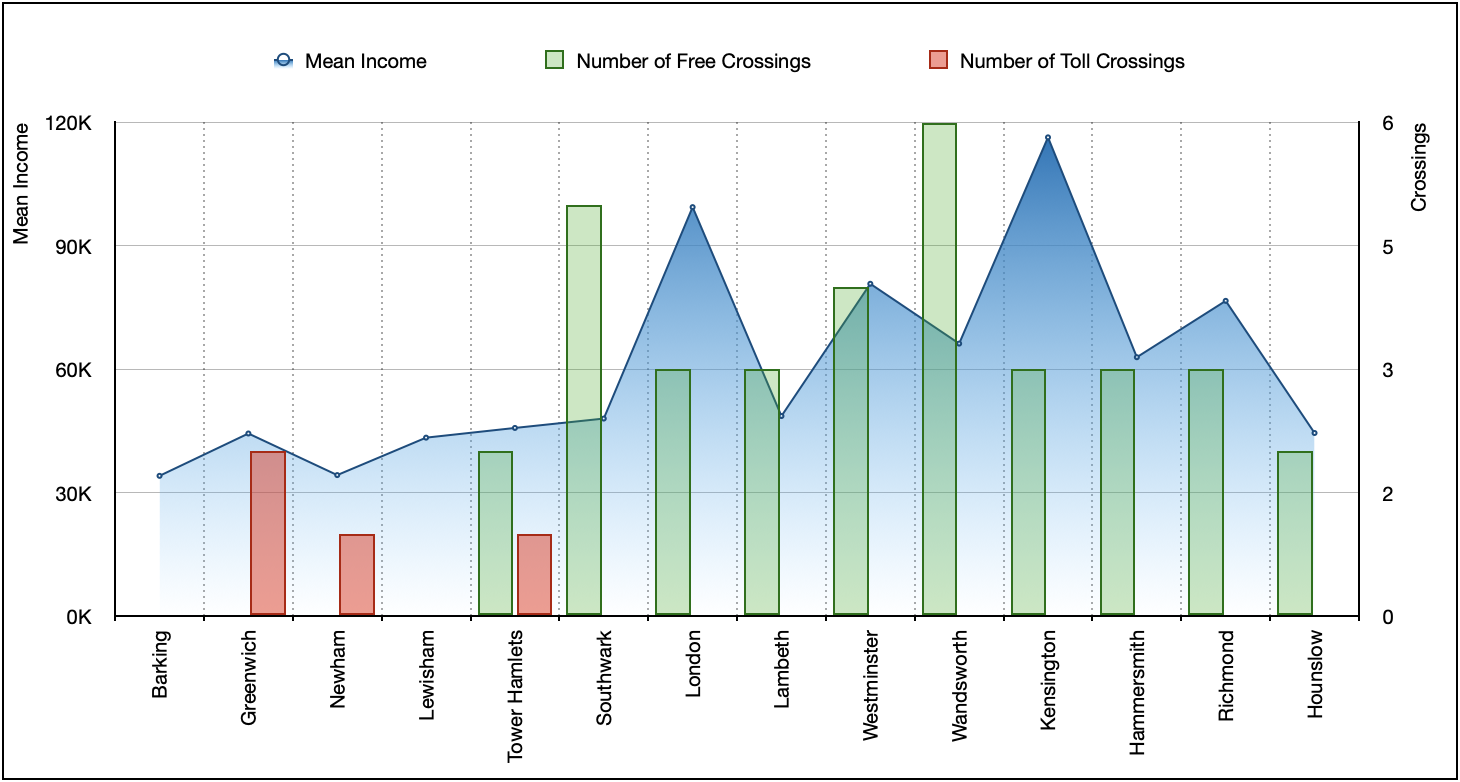
Borough |
Mean Income |
Number of Free Crossings |
Number of Toll Crossings |
|
Barking |
34,080 |
0 |
0 |
|
Greenwich |
44,370 |
0 |
2 |
|
Newham |
34,260 |
0 |
1 |
|
Lewisham |
43,360 |
0 |
0 |
|
Tower Hamlets |
45,720 |
2 |
1 |
|
Southwark |
48,000 |
5 |
0 |
|
London |
99,390 |
3 |
0 |
|
Lambeth |
48,610 |
3 |
0 |
|
Westminster |
80,760 |
4 |
0 |
|
Wandsworth |
66,220 |
6 |
0 |
|
Kensington |
116,350 |
3 |
0 |
|
Hammersmith |
62,910 |
3 |
0 |
|
Richmond |
76,610 |
3 |
0 |
|
Hounslow |
44,490 |
2 |
0 |


